
I gave this talk on October 21st at NACIS 2026’s Practical Cartography Day. It’s a lightning talk, which means I had eight minutes to deliver it! As a generally high energy speaker, I really like lightning talks, as I can cram a lot of information in to a short window. As I told the audience, longtime attendees may recognize this approach from my talks on locators and map scales, and to those unfamiliar with me, well, I guess just know that I really like to dive into the basics of mapmaking. All maps shown are by me unless otherwise noted.
In 40-some years of annual meetings of NACIS, as far as I can tell, legends have not really been the topic of much conversation. There was an excellent talk from Esri’s Aubri Kinghorn in 2023 classifying types of legends. And there were two features I don’t have much information on: in 2007, a poster from Tom Harrison entitled “Legends Are Made to be Broken”

and, in 1984, a special exhibit called “Cartographic Legend” from Robert E Lyons of the Hecla Mining Company.
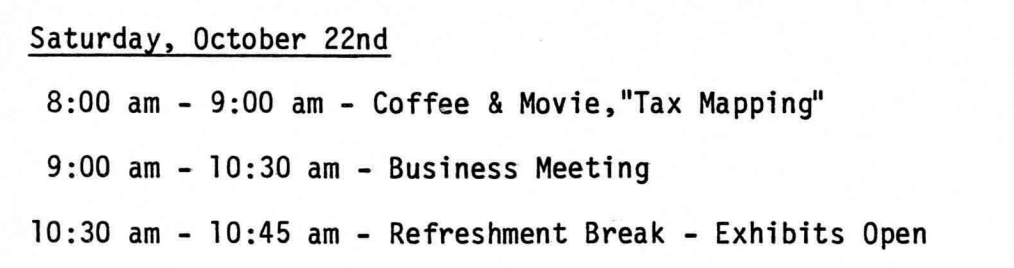
I also saw that almost 43 years ago to the day, we showed a movie called “Tax Mapping” at 8am???
But I went through every program and there appears to have never been a talk specifically about legend design, which seems like an oversight somehow? Or was I getting up in front of the PCD audience and telling everyone things they already know? If so, well, it was only a lightning talk. But I do hope you’ll pick up some ideas and inspiration over the next eight minutes however long you want to scroll through this.
I’ve judged a few map competitions in my day, and I’m currently an Instructional Assistant with the University of Washington’s Principles of Cartography & Thematic Design class. I look at a lot of maps!!! I make a lot of maps!!! At any given time I am probably thinking about or writing about or talking about maps.
Legends are an integral part of cartography, a key link between the map maker and the map viewer. A good legend translates the subject matter from geodata into clear, comprehensible ideas. A great legend enhances the story the mapmaker is telling.
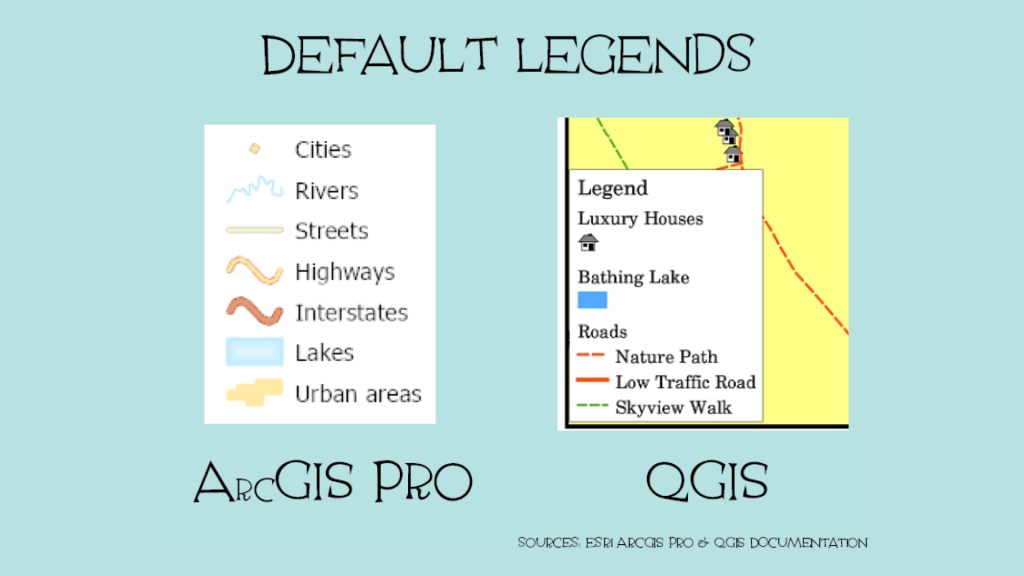
These are the basic default legends in ArcGIS Pro and QGIS, they don’t all look exactly like this, obviously, I pulled these from each software’s documentation, and to be clear, they are fine. They are the most common legend structures because they are near-universal in applicability. When I am evaluating a map I’m never going to mark someone down for using them. I personally use legends like this all the time. Why wouldn’t I? They work!
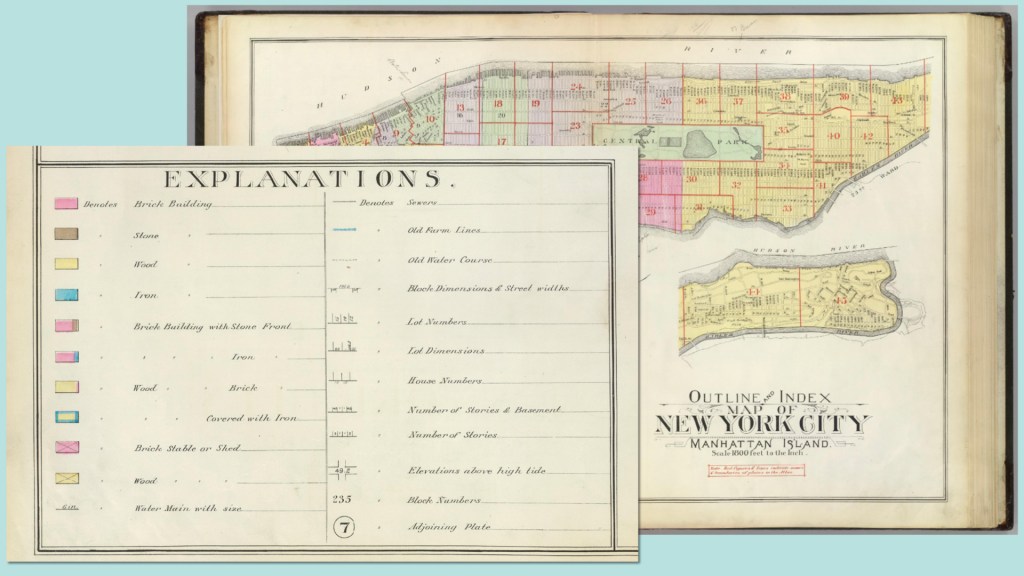
This is what most legends look like and have since time immemorial. A visual representation and a brief description of that thing. This is a legend from the “Outline and Index Map of New York City, Manhattan Island” created by George Washington Bromley and Walter Scott Bromley in 1891.
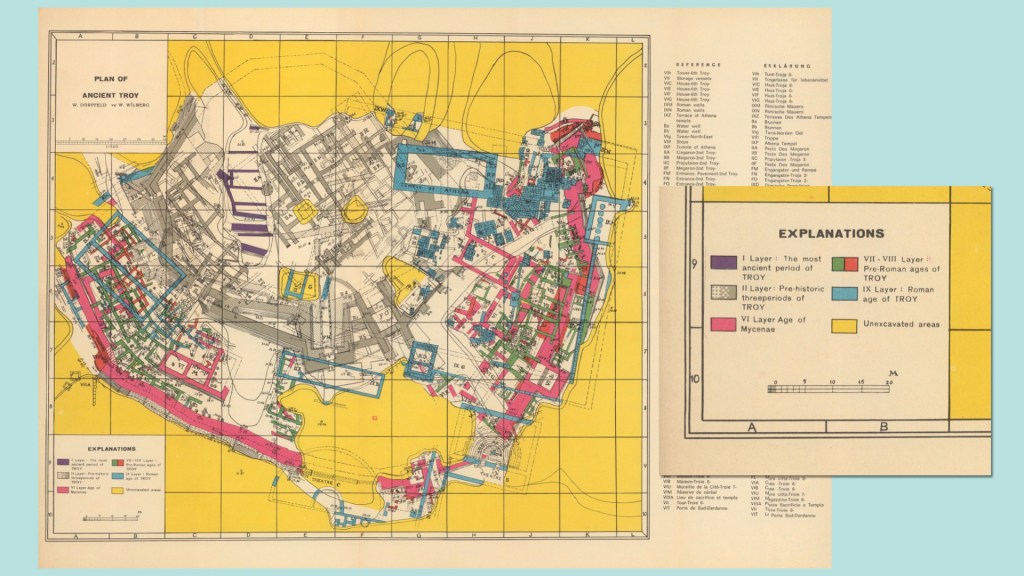
This is a legend – or I guess some Explanations, maybe we should bring back that title? – from a 1960 plan of ancient Troy by Wilhelm Dörpfeld and Wilhelm Wilburg. It is fine. There is nothing wrong with a legend that looks exactly like a legend (or an explanation). I am not telling you that you need to change your work.
But sometimes you want to go deeper. You want your map more immersive. You want the story to be all-encompassing. Or maybe you just…don’t feel like making a regular legend. Either way: here are five ways to break out of the default.

Wrap your legend in a cartouche or similar design element. In cartography, a cartouche is a decorative emblem that contains information about the map – sometimes its the scale, cartographer, publisher, or other information. Often, it contains a legend, too.
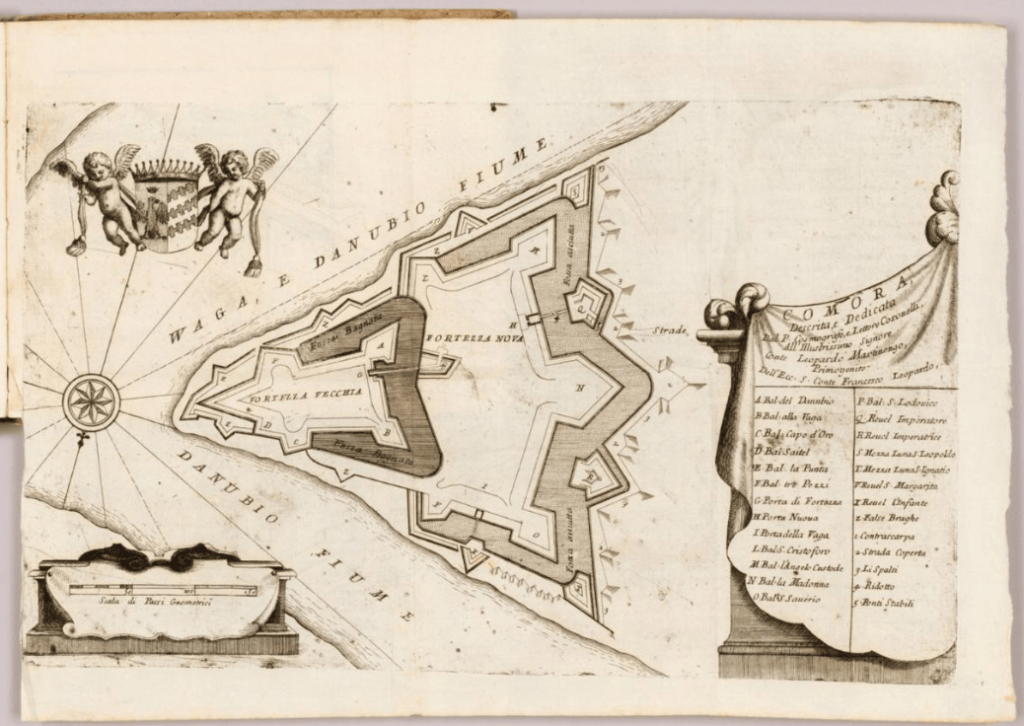
Cartographers have been doing this for centuries. This 1707 Italian map of Comara, in modern day Hungary, has a legend, maybe more of a key, draped on some fabric. It lends a sense of grandeur and elegance that a standard legend lacks.
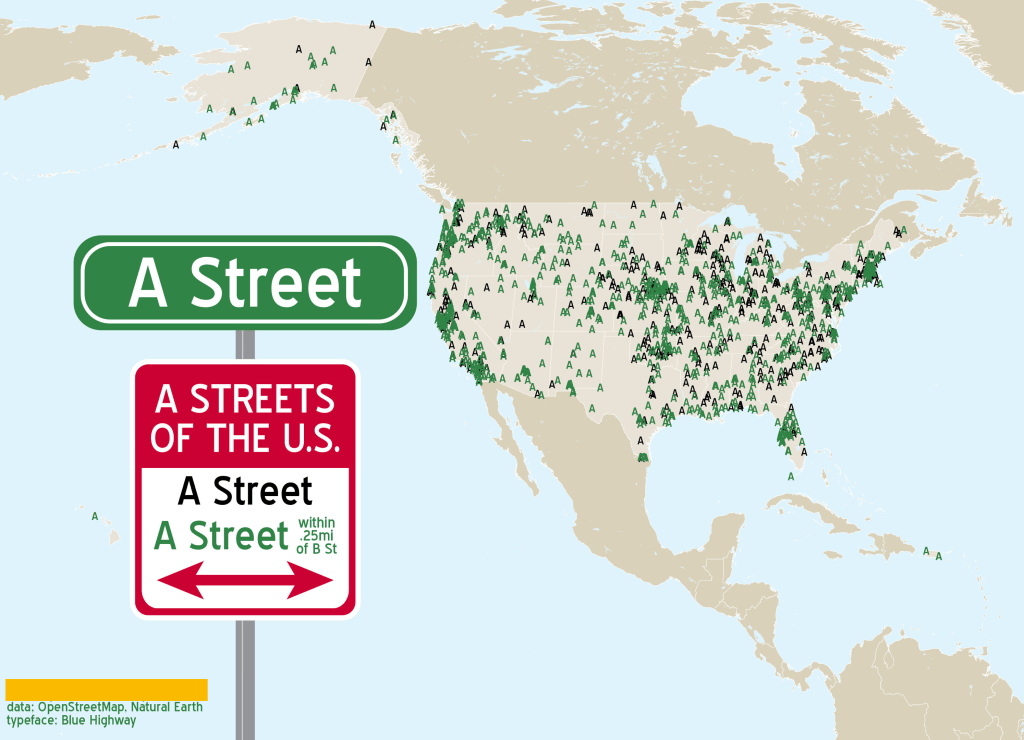
This is a map I made a few years ago on the 30 day map challenge prompt “A Map,” of all of the A Streets in the US. It’s a pretty standard legend but it’s designed to look like a street sign. Nothing too fancy, but it’s just a little more fun. It encourages the viewer to engage with the subject matter.
It also does not have to be bigger than the actual map? Interesting choice from past me there.
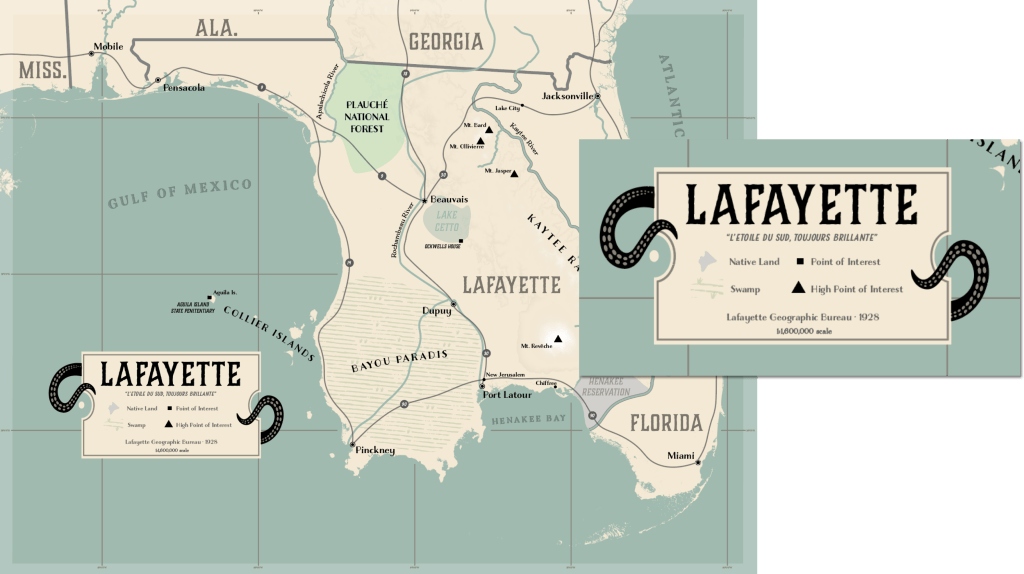
It’s also a good way to elevate a legend that is in itself otherwise not that interesting or complicated. This is a really simple legend, but a few surrounding touches bring it in for a more immersive feeling
This map was commissioned for a tabletop role playing game a few years ago, so I pulled design element inspiration from travel maps from the 1920s and 30s (it was an alternate universe setting, don’t worry I know Florida doesn’t look like that).
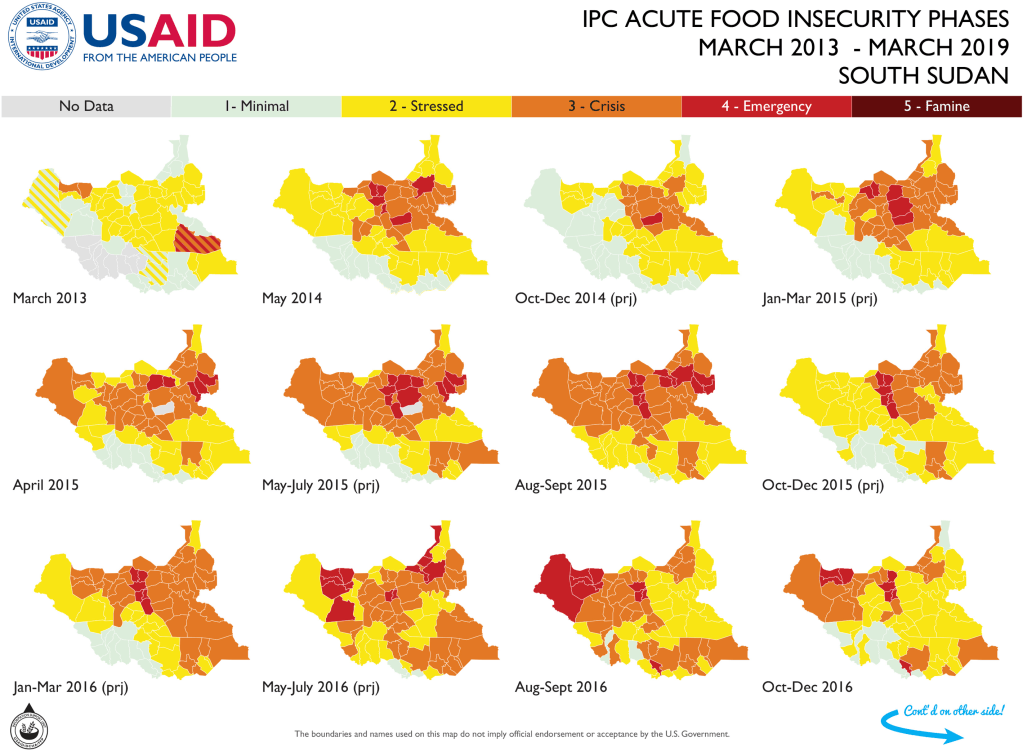
It can also be a structural element on the page. Think about times when you’ve had to work under tight space constraints. For this map I had the right amount of small multiples for the page and no room for the usual legend, but I could fit it into a narrow bar across the top. You can be flexible!
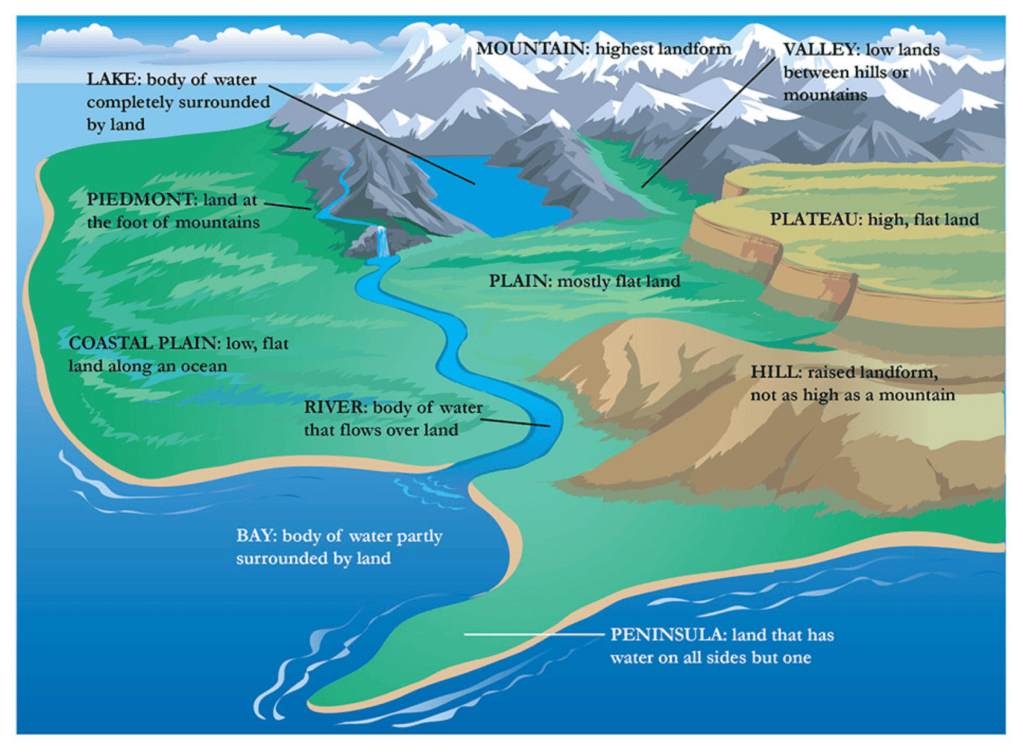
Think of those maps like in your intro textbooks, like this one here from National Geographic’s Education resources, that are like a legend for the whole earth. It helps to show the content in context.
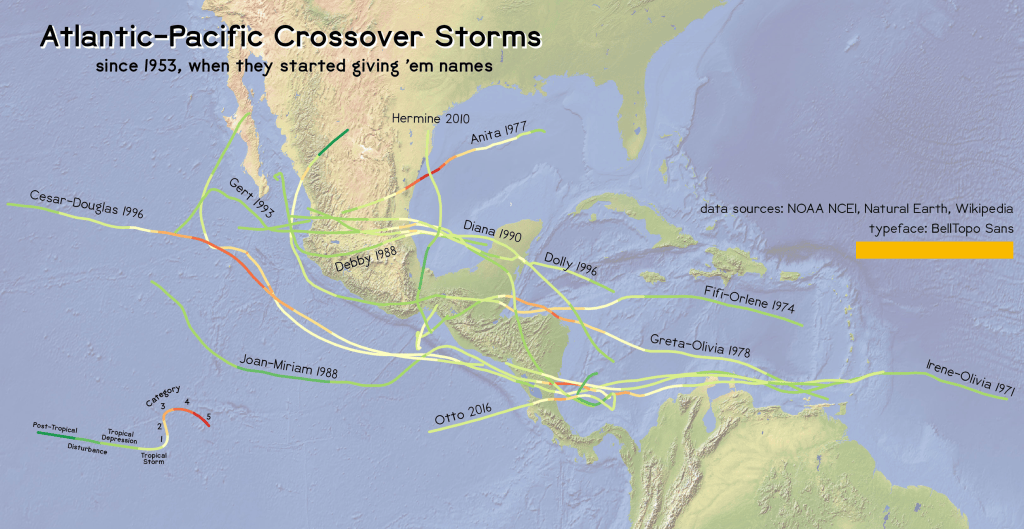
Here’s an example of what that looks like on a map – I used a small diagram to show the storm strength with the same general appearance as that information appears on the map. These things that exist next to each other on the map are similarly continuous on the legend.
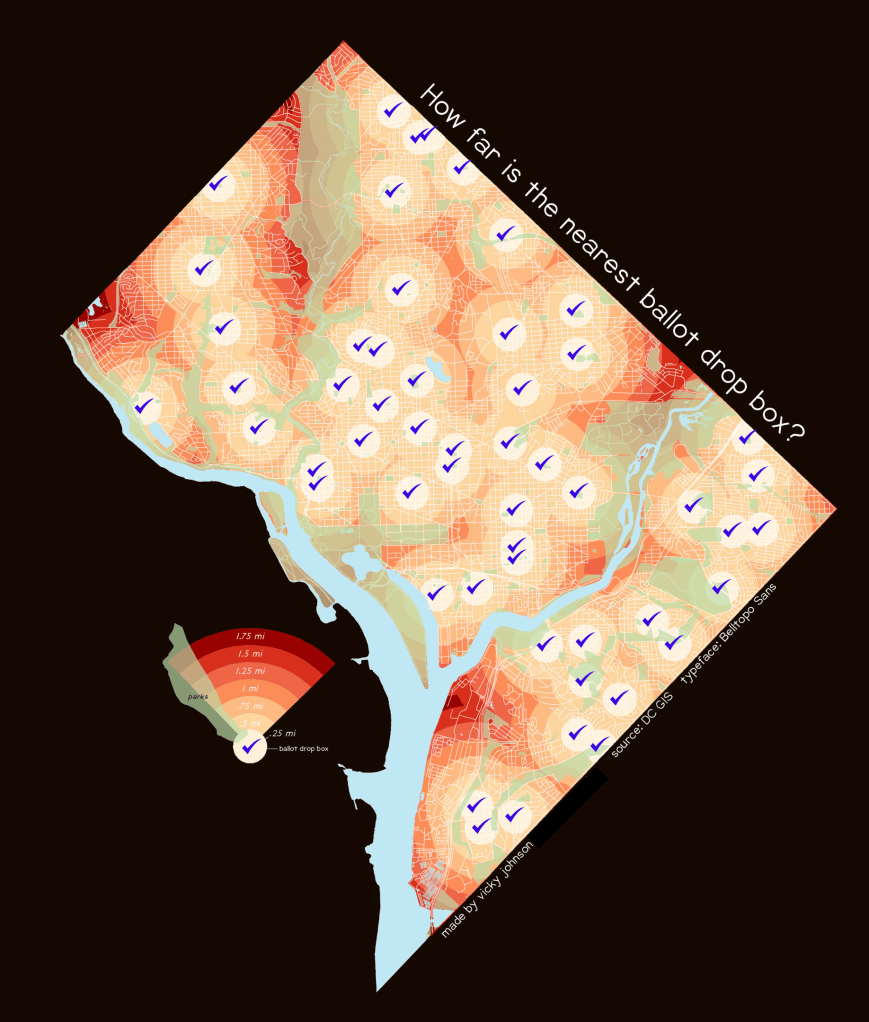
Here’s another example: DC ballot boxes. You can see clearly how the semitransparent green park color overlay acts with all of the red hues together, so the viewer is able to read the map more clearly even with that additional layer partially obscuring the main information.
I also like how the shape looks like a little amplifier, which works on a map with voting messaging.
I tried to find good examples for these – all of the historical examples are from my best friend, the David Rumsey Map Library – but turns out it is very hard to search by legend type.
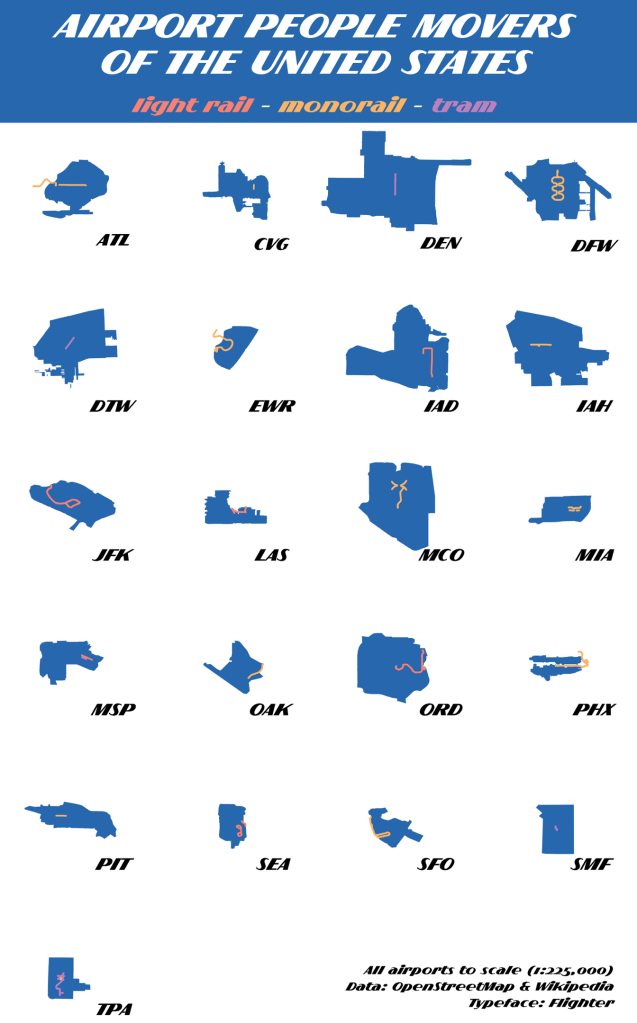
This one is my favorite approach because it is eeeeeasy. You’re already putting a title and text on the map, make them work for you. It’s also a great space saver. I find it works best for maps where the categories are very distinct and non-graduated.
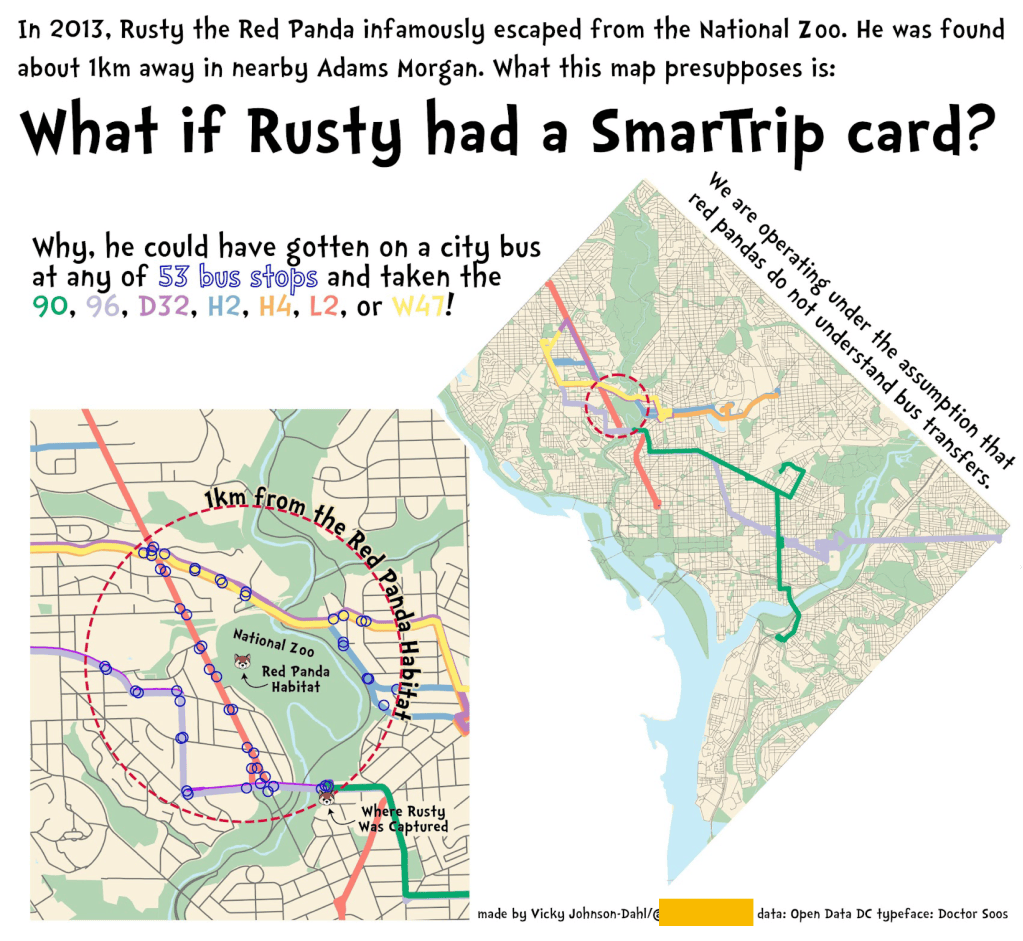
This map shows DC bus lines an escaped red panda could have plausibly taken, a concept which does admittedly require a little explanatory writing. Why not use that as a legend, too? It helps to make sure that the map viewer is taking in the words as well as the images.
Honestly not a lot to say about this one. I really like making these. I just think they’re neat!

I delivered this talk knowing I only had eight minutes and I put this in as a slide anyway.
…by which I mean, use strategic labels.
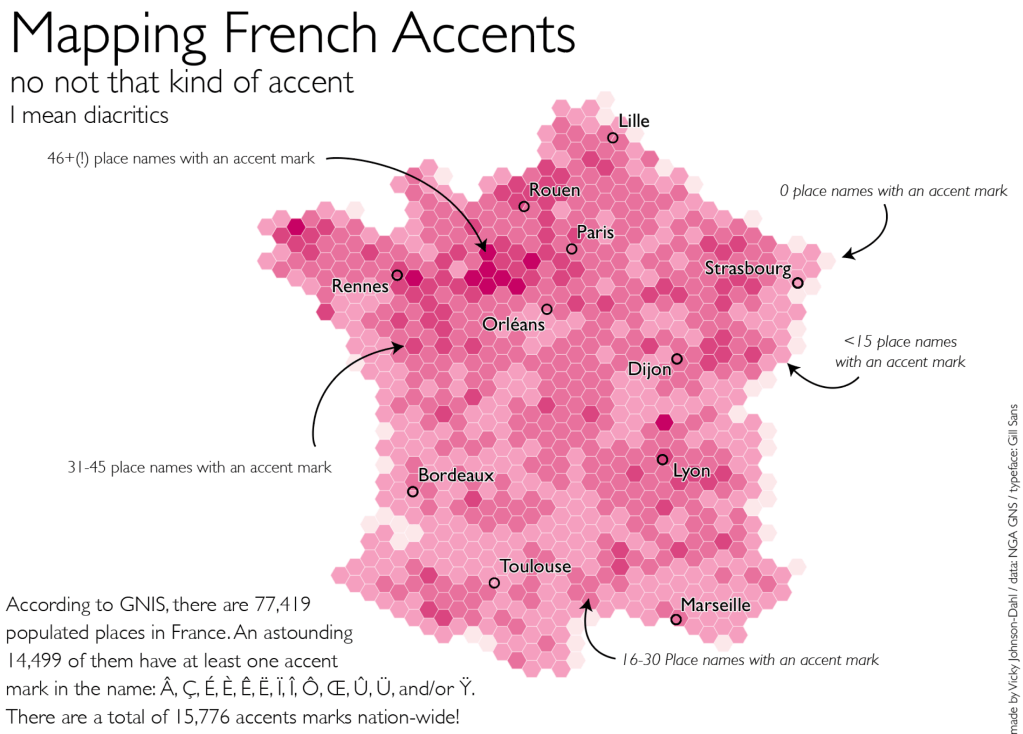
This is a good strategy for when you don’t have a good single space for a legend block, but have a lot of smaller spaces scattered throughout. And of course the above map is not an example of that, but it works the other way, too, there is a ton of available white space, the notation text the viewer a clear path to follow. The arrow swirl helps as well.
What I am showing with this example, this approach really works best for informal, almost chatty design work, where you want to both engage the viewer and get them to consider different places on your map in relation to each other, as your viewer will have to follow what you are telling them across the map space. Here, I want the viewer to think about France and what has influenced her toponyms. The Eastern part with more of a German language cross-pollination has fewer accent marks, compared to the wealth of diacritics in the Northwest part of the country and the Loire Valley. I want to lead the viewer along that line of thought, but have them arrive there on their own.
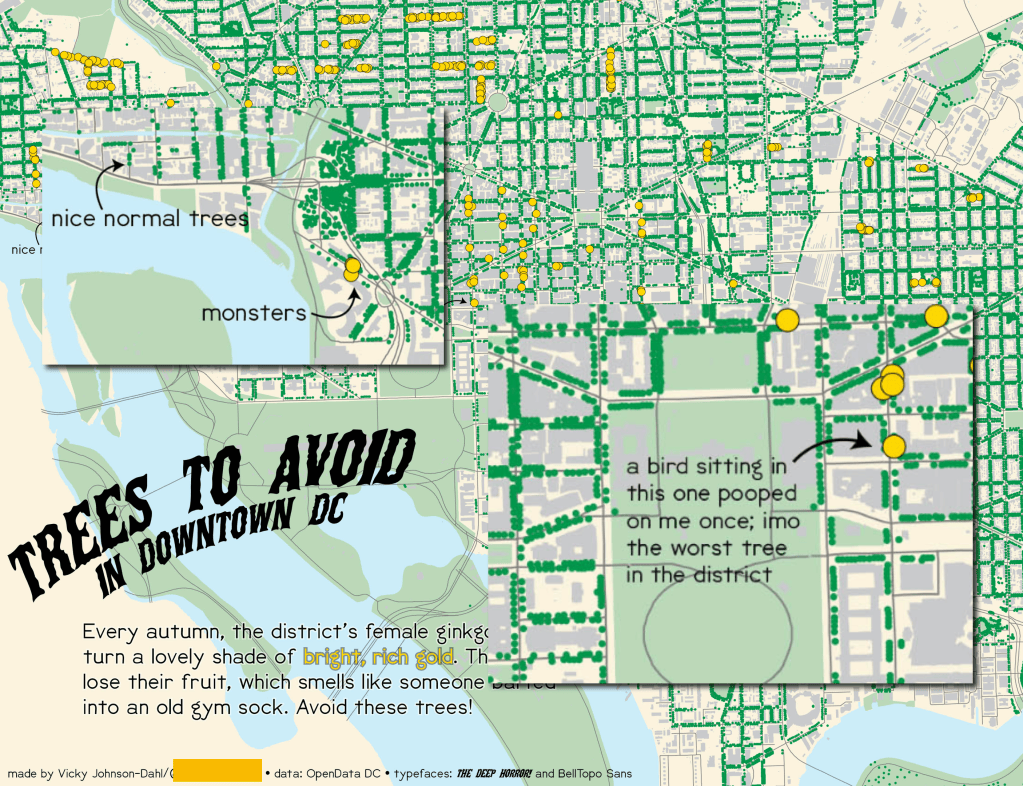
I don’t need a legend box for two dot types on a very informal map, and the format lets me highlight other details or one off items of note that you wouldn’t put in a legend but to which you still want to draw attention.
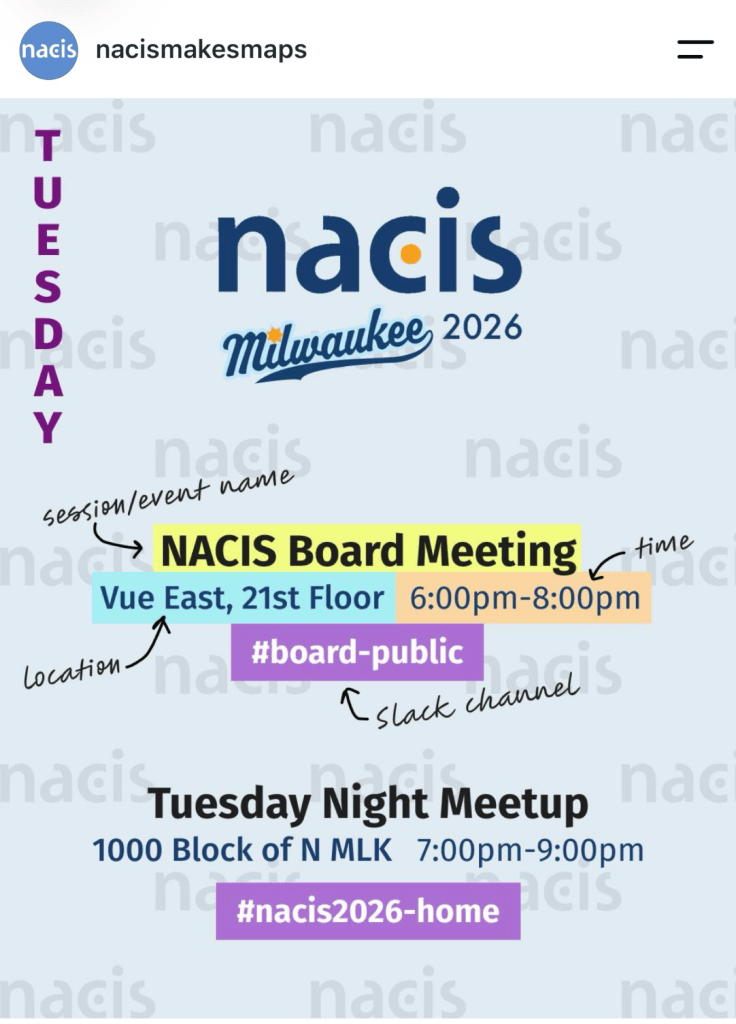
It’s not just for maps, I saw this from the NACIS instagram account and it fits the concept beautifully, because it’s drawing you in to the format. And it’s a perfect example of how this approach works where the same structure is repeated for changing information.
It also gave me a chance to plug the NACIS instagram! Follow @NACISmakesmaps! You can submit your work for Map of the Week even if they don’t have a fun legend. But definitely submit your fun legends.
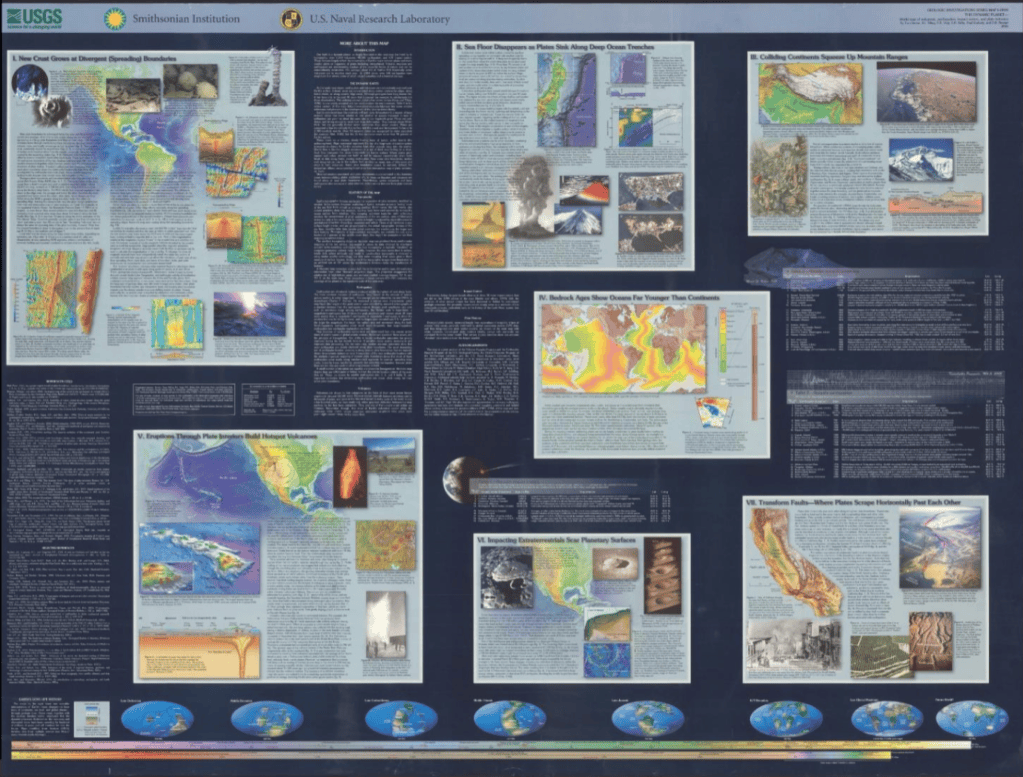
I love this USGS poster. But let’s take a closer look at what’s going on in that block towards the middle.
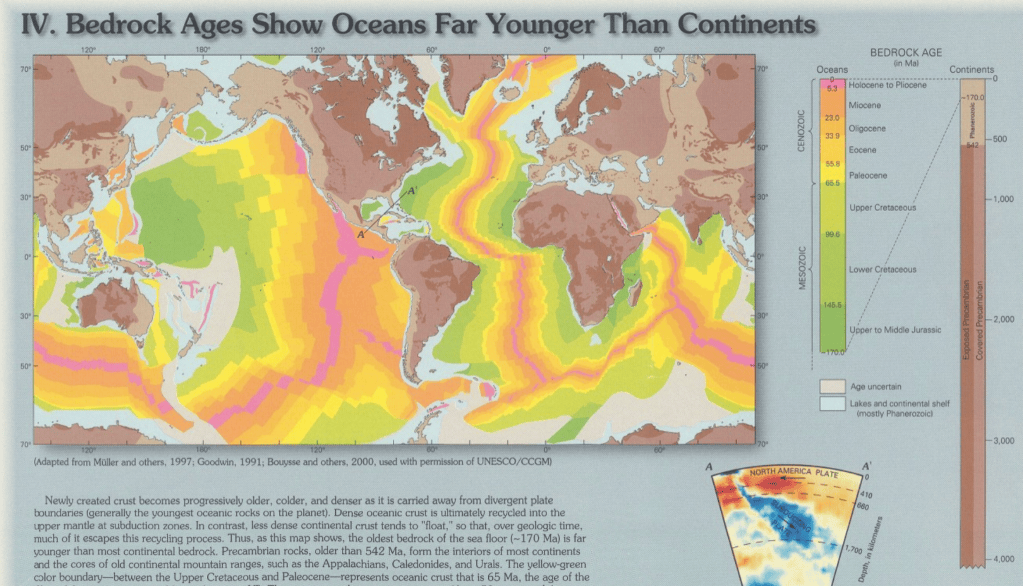
That’s better. Take a look at the timeline on the right – this shows the age of the earth’s bedrock, with the color coding by years. This timeline is to scale, giving the map viewer a visual comparison of each bedrock age in order, in relation to each other. It’s both more intuitive and more understandable than seeing the time lengths, which vary greatly in span, just aligned with with standard legend blocks.
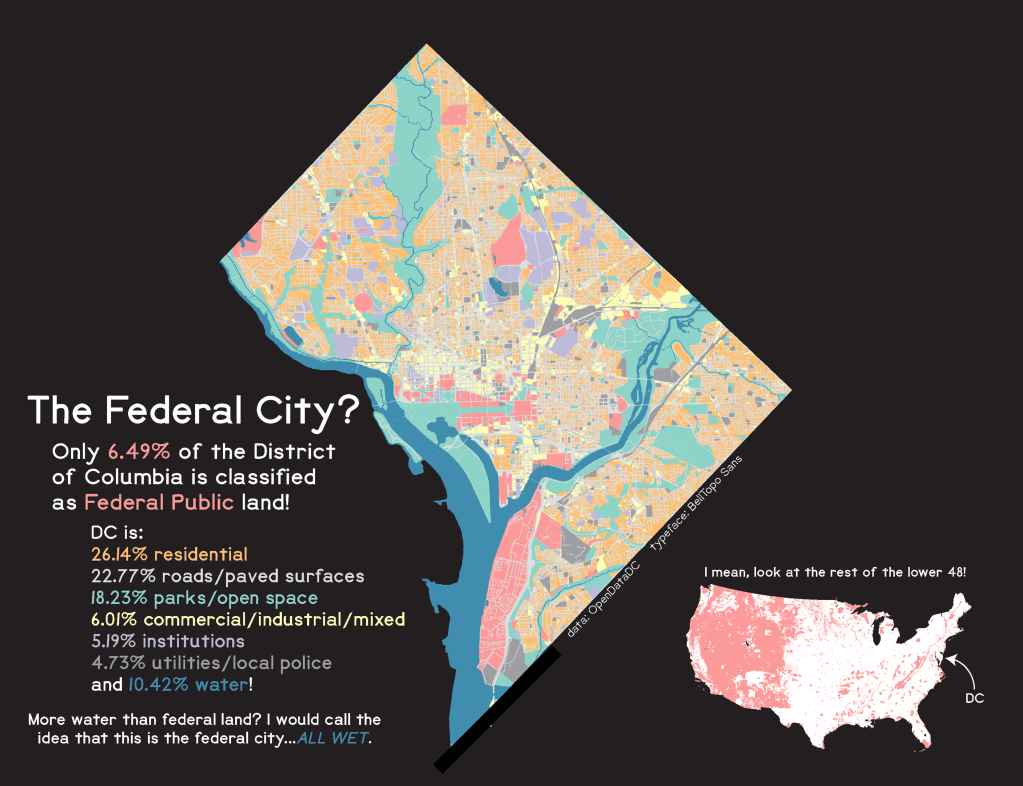
You can tell more of your story with the legend. Here, I used the color coding on the map to tie in the statistics about District of Columbia land use. The map viewer is making connections between what they see on the map and the message the map is sending. It is also using the text as the legend – did I mention these work great in combination?

